Getting Started
- Select Documents to Compare: In the right panel, use the data table to select the KBOs (Knowledge Base Objects) you want to analyze. Check the boxes next to each document title you wish to include.
- Choose Words to Analyze: In the middle panel, you can manually enter words to compare or use the "Recommend words" feature:
- Click "Recommend words" to automatically identify the most common terms across your selected documents
- Or manually add words using the "Add word" button (limit of 10 words for optimal readability)
- Remove any unwanted words by clicking the "x" button next to each word
- Generate Your Analysis: Click the "Analyze" button at the bottom right to create your comparison chart.
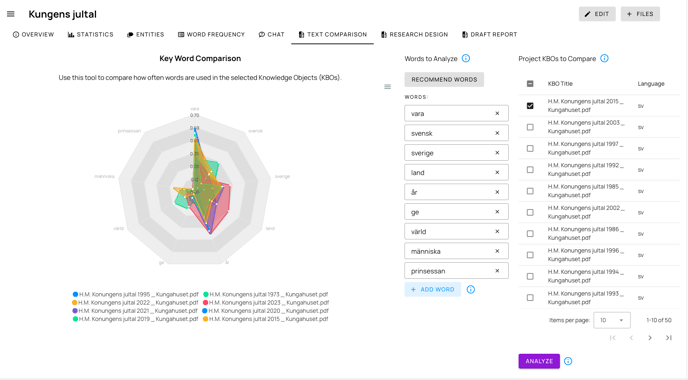
Understanding the Radar Chart
The radar chart displays in the left panel after analysis. Each document appears as a different colored line on the chart, with each axis representing one of your selected words. The distance from the center indicates the relative frequency of that word in each document.
Perfect for Comparative Analysis
This feature excels at two key types of document comparisons:
- Cross-organizational comparison: Compare similar documents from different organizations or countries, such as national security strategies, policy frameworks, or climate action plans. Quickly identify differences in priorities, terminology, and focus areas between entities.
- Temporal analysis: Track how the same recurring document evolves over time by comparing different versions published periodically. Ideal for analyzing annual reports, threat assessments, policy updates, or regular publications to spot emerging trends, shifting priorities, or changing language.
Tips for Effective Comparison
- Select documents with similar themes or topics for more meaningful comparisons
- Limit your analysis to 4-5 documents and 7-10 words for clearer visualizations
- Use the toolbar in the top right of the chart to download your comparison as SVG, PNG, or CSV
- Be aware that only documents in the same language can be effectively compared
Saving Your Analysis
Your word selections and document choices are automatically saved to your project when you click "Analyze," allowing you to return to your comparison later.